Looking into the second half of the year, we are marginally wiser on the major issues of the moment, but financial markets seem to have made their minds up on a few things. Most importantly, that the energy crisis will not materialise as feared, and that AI (artificial intelligence) will be bigger than we previously expected.
First on the topic of energy, President Trump has signed a deal with Iran, which conveniently pushed out the difficult issue of their nuclear fuel, but crucially re-opened the Strait of Hormuz for shipments. At the time of writing, there is still some confusion and attacks continue, but as evidenced by the concessions he made to Iran, Trump clearly wants out of the mess he created.
Second, on AI, we are seeing more of an impact on both economy-level and company-level data. Of course, the impact is not evenly spread across sectors or geographies, and the sustainability and profitability of the colossal investment are crucial open questions.
Meanwhile, as economists and analysts agonise over these questions, the stock market continues to power ahead. Despite all the documented concerns, the IPO of SpaceX, by far the largest in history, shows there is plenty of appetite for ambitious growth stories.
Figure 1: Asset class performance in the first half of the year (H1)
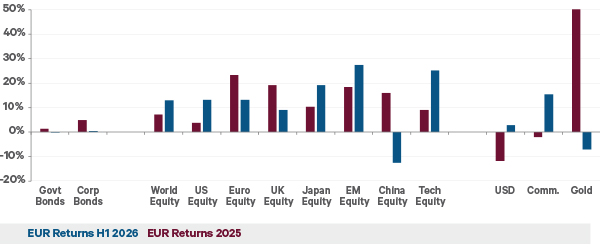
Source: Bloomberg, MSCI. “Comm.” is short for commodities. All are total returns in euro. Bond returns are hedged to euro.
Oil vs tax cuts and AI investment
At 60-70%, personal expenditure is by far the largest portion of GDP1, or economic activity, in developed countries, but the cyclical swings in an economy tend to come from changes in business investment, so we need to gauge the forces pushing both up or down.
Despite the negative impact of his trade wars and actual wars, President Trump has also spurred a significant growth impulse. Last year’s OBBBA (One Big Beautiful Bill Act) of tax cuts and investment incentives has been a sugar rush for the US economy this year, more than offsetting higher energy prices, although more so for higher earners and corporates.
Figure 2: Composition of US growth 2020-2026
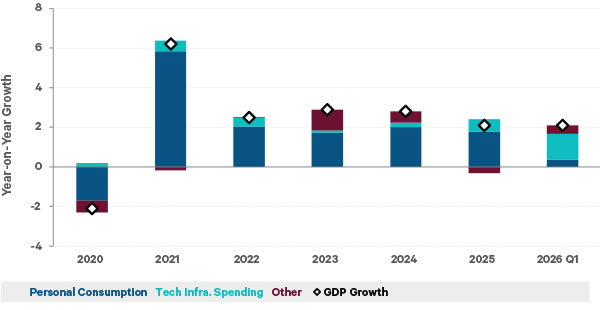
Source: Bureau of Economic Analysis. GDP is gross domestic product, the standard measure of national economic growth.
Yet when it comes to business investment, there has been no bigger boost (this century at least) than the enormous investment in AI. GDP statistics are not a great way to measure its impact2, but a simple decomposition of recent years’ growth suggests that the build-out of the new technology has been a huge contributor to the US economy.
At first glance it might look like the US consumer is in trouble, but retail sales have grown just fine, even when higher fuel costs are excluded. As a nation of equity investors, Americans are saving less as their net worth increases. Twenty years ago, it was the housing bubble, this time the wealth effect of the stock market is making Americans feel richer and spend more.
Figure 3: The ‘wealth effect’ for US consumers
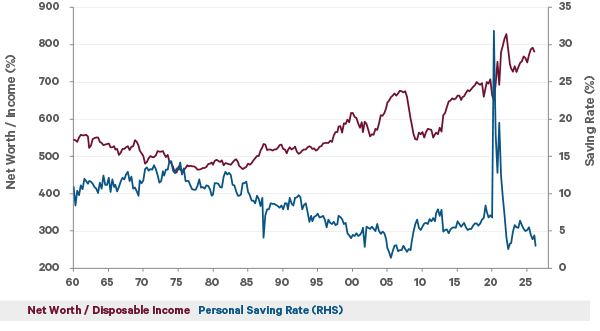
Source: Federal Reserve Bank of St Louis. Net worth and savings rates are as a percentage of disposable income.
Now we don’t need to catastrophise about an AI bubble to realise that these consumer gains cannot continue indefinitely, so we still check on jobs and wage growth. The good news here is that the US economy is creating jobs again and barring the recent energy bump wages have been growing ahead of inflation.
US exceptionalism strikes again
Unfortunately, the mix of forces driving the economy has been less favourable outside the US. The Eurozone and UK are more vulnerable to higher energy prices, and they don’t have the softening impact of tax cuts and the huge boost from AI. This divergence is evident in the evolution of growth forecasts for 2026.
Figure 4: 2026 GPD growth forecasts for US and Europe
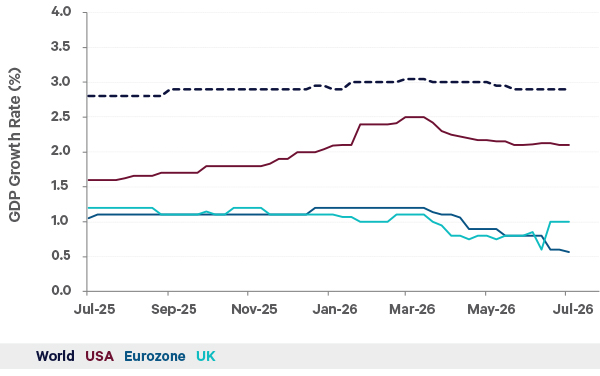
Source: Bloomberg. Forecasts are in real GDP terms in each local currency.
But energy prices are almost back to their pre-war levels now, and the US won’t get another big tax cut like the OBBBA, so the growth gap shouldn’t keep widening. In fact, European business surveys appear to be inflecting upwards from their slump, and there is still the long-awaited boost from defence and infrastructure spending, whenever that arrives.
As for the UK, despite the failure of Starmer and Reeves to convince markets and voters that recovery was on the way, the first quarter data was better than expected. The economy grew more than forecast, with both inflation and unemployment falling, and wages growing faster than inflation. There is scope for a new prime minister to project a better story.
Central banks changing gear
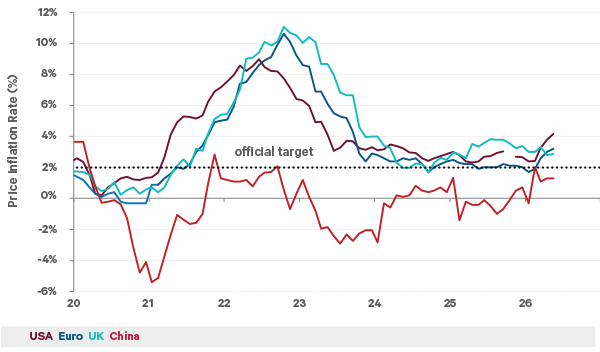
With war in the Middle East and an industrial AI investment boom, inflation is naturally in the headlines again this year. However, despite the largest shutting-off of energy supplies in market history, consumer price indices are nowhere near their highs of 2022.
Figure 5: Consumer price inflation in US, Europe and China
Source: DataStream. All price indices are in local currencies.
With the exception of China though, inflation is still comfortably above the official 2% target, and markets are wondering whether this is a temporary blip or if central banks will need to increase interest rates. As oil prices fade back to pre-war levels, inflation will likely ease off too, but the reaction of each central bank will differ by their circumstances.
Before the attacks on Iran, the euro rate was only 2%, leaving the European Central Bank (ECB) with plenty of room to hike. The ECB’s mandate is price stability, and they tend to prioritise inflation over growth. So, it was no surprise that they raised rates in June by 0.25% to 2.25%. Now that inflation is already softening, we doubt they will go much further, if at all.
With the pound rate at 3.75%, UK monetary policy was already tighter, and with inflation below 3%, it’s not clear that the Bank of England (BOE) needs to hike rates. Given the UK’s fiscal situation, they won’t want to make government debt funding more expensive either, so the market pricing of one 1/4-point hike, down from three, may be revised down again.
The story gets more interesting in the US, whereafter resisting the president’s pressure for the past year and a half, Jerome Powell’s term as chair of the Federal Reserve (Fed) expired, and Trump’s new candidate, Kevin Warsh, took over in June. Will Warsh be his own man or will he give the president the lower rates he has called for?
In his first meeting, he certainly positioned himself as a new man. He will set up various work groups to assess how the Fed operates. He favours less communication, which he views as the Fed spoon feeding the market. He acknowledged that inflation was too high, and he wants to shrink the enormous Fed balance sheet (almost US$7tn), which seemed to please the market.
Figure 6: US job growth vs inflation
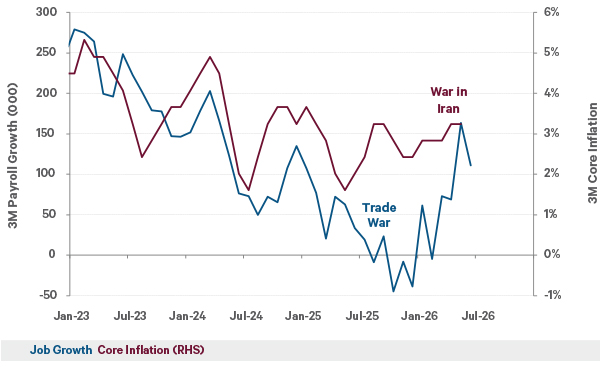
Source: Bloomberg, Bureau of Labor Statistics. Both inflation and job growth are 3 month rolling averages.
As for what he will do with interest rates, his initial inflation comment was taken as a sign that he may raise rates, but his subsequent comments that inflation risk had come down show that he likes to keep markets guessing. Given the moderation in job growth in June, the data is not forcing his hand either way, so our best guess is for little change for now.
Are the bond vigilantes back?
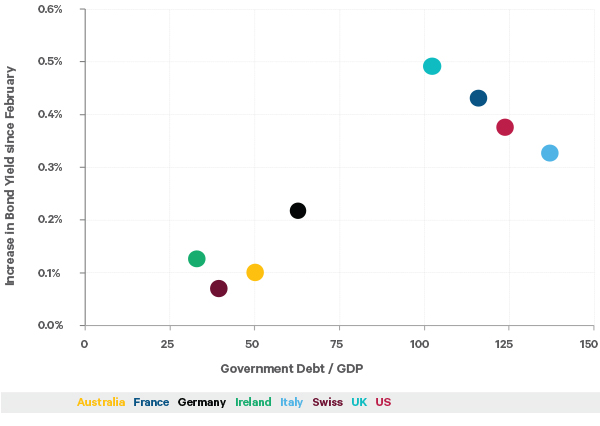
While the markets’ reaction to the Iran conflict played out mostly in commodity prices, we also saw its impact in bond markets. On the surface, the rise in bond yields from March through May was an understandable reaction to higher inflation. But through the oil price and bond yield volatility, a familiar pattern emerges.
Figure 7: Change in bond yields vs government debt levels
Source: MSCI, Davy. Expected earnings growth in October was for 2025-27 and in March was for 2026-28. Percentiles are based on data from 1995 to present. All indices in US dollars, except Eurozone in euro and UK in pounds.
Since the global financial crisis (GFC) in 2008, the standard government response to crises has been to borrow and spend their way out of trouble. However by doing so they have raised doubts around their fiscal sustainability, which is reflected in higher bond yields in general, and higher yield increases in stress moments.
The UK is an interesting case. The Truss-Kwarteng budget disaster in 2022 hung over Reeves and Starmer, and despite Burnham’s claims to the contrary, bond markets will box in the new PM too unless he can deliver a credible plan for growth. And before the Eurozone gets too smug about their lower borrowing costs, next year’s French election will test euro yields too.
As for the US bond market, Kevin Warsh’s hawkish posture in his first Fed meeting pushed up shorter term yields in anticipation of higher rates than previously expected, but encouragingly also led to lower long yields as markets welcomed the reduction in inflation risk and the moral hazard that would come with less market intervention from the Fed.
Lastly, although bond vigilantes tend to focus on sovereign debt, now that the AI hyperscalers3 have taken to the bond markets, they may start watching corporate bonds too. Yield spreads over government bonds are abnormally low, providing very little compensation for credit risk, and time will tell if this will be allowed to persist.
Not your 90s bubble
Partly because of the generous equity returns of the past few years, led by the technology sector, and partly because of the outrageous valuation attained by SpaceX in its June IPO, fears of an ‘AI bubble’ have intensified. To be clear, we don’t believe that we’re going through a repeat of the late 1990s technology bubble. There are some worrying trends, and some mitigating differences.
Figure 8: Valuation of major indices vs their historical ranges
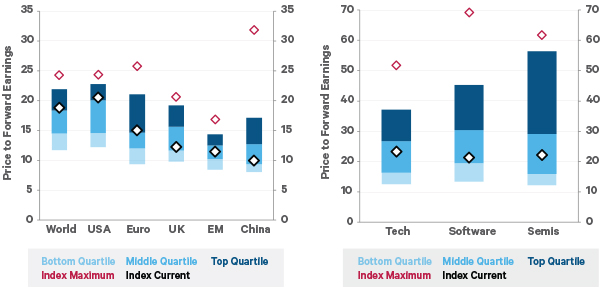
Source: MSCI, Davy calculations. The historical range measures from 1995 to the present. Each regional index is in local currency, except World which is measured in dollars. The top quartile runs from the 75th to 95th percentile, and the bottom quartile run from the 5th to 25th percentile.
First valuations; price / earnings (P/E) ratios are well above average, but not as extreme as in the late 90s, and not as uniformly high across the board. While the US index is around the top decile of its historical valuation range, there are countries and sectors with more reasonable ratios, in absolute and relative terms.
Another important reason that valuations are not so scary is that most of the recent returns have come from earnings growth, not just the market getting more expensive. This is particularly the case in the technology sector, so much so that commentators are now calling it an ‘earnings bubble’, rather than an old-fashioned price bubble.
What matters most is not what we call it, but how sustainable it is. If we compare it with previous earnings cycles, we see that recent growth has not been that unusual, partly as it came out of the slump in 2022-23. So without taking a view on the potential of AI, it’s not unreasonable to expect earnings to grow further from here.
Figure 9: Rolling 3-year earnings growth for the world index and semiconductors
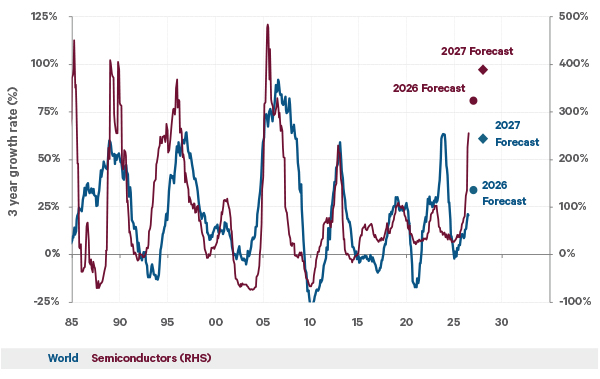
Source: DataStream, IBES, Davy. Index price and earnings in US dollars.
But detractors will point out, correctly, that the market already expects more growth from here, and this is priced into current valuations. If we include the earnings forecasts for 2026-27, this would turn the current run into one of the strongest 3-year rises on record. Similar growth surges in the past were only seen after steep declines.
The other thing we realise is that technology profit cycles, especially for chip-makers, are so volatile that straightforward price/earnings ratios will struggle to capture them. For this reason, analysts and academics often use ‘normalised earnings’, meaning longer term or trend earnings, typically over 10-year windows4, which are more stable measures.
If we use normalised earnings, we see that current valuations are still high by historical standards, and the US index is close to an all-time high. Which metric is right? Bulls will say that long term measures overlook the amazing growth from AI, and bears will say that nothing grows that fast forever, and they both have a point.
Figure 10: Equity valuations using normalised earnings
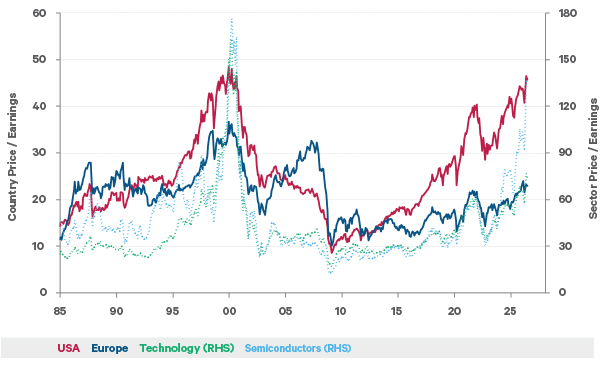
Source: DataStream, Davy. All indices in US dollars, except Europe which is in euro. Normalised earnings mean a rolling 10-year average.
It’s important to stress that valuation is not a timing signal, more a measure of how vulnerable an asset is to disappointment. A fall-off in AI-related earnings, or forecasts, would likely be the trigger for such disappointment, with the most expensive AI-related investments seeing the most damage.
In summary, the outlook from here is better than we expected in Q2 2026. The oil price surge was short-lived as markets didn’t believe that the war in Iran would persist or spread further. As a result, the conflict has had little impact on growth and caused only a mild bump in inflation.
Economic growth has continued close to its modest trend levels in the Eurozone and UK and continues above trend in the US thanks to the Trump tax cuts and the enormous AI investment. Importantly, the risk of recession has fallen significantly.
With inflation only mildly above target, we don’t see major central banks hiking rates much, if at all, for the rest of the year, and certainly not enough to derail the US or European economies. We will be watching Kevin Warsh at the Fed to see how US monetary policy might evolve.
As for bond markets, the rise in long-term yields in the second quarter has abated, but they will be watching central banks and government balances for signs of weakness. Corporate credit risk, and yield spreads, remain low, which may change as AI hyperscalers issue more debt.
Given the benign macro environment, it’s not a surprise that the stock market is doing well. However, the concentrated nature of returns and earnings growth is a cause for concern, and even though overall valuations are not extreme, there are stocks and sectors that are running too hot.
Recent volatility in American and Asian chipmakers shows that markets are aware of this problem, and as more AI-related companies raise more capital, sensitivity to AI bubble fears will grow. Rather than try to time when this cycle might turn, we prefer to hold reduced allocations to the most stretched areas and forgo some of the frothier returns.
Lastly, President Trump’s confidence appears to be slipping and his focus shifting, but with midterm elections in Q4, and the prospect of a split Congress for his last two years, we can’t rule out more surprise actions from him. So, we intend to keep our portfolios diversified and ready to adapt should opportunities arise.
Figure 11: Strategic and tactical asset allocation for EUR moderate growth portfolio
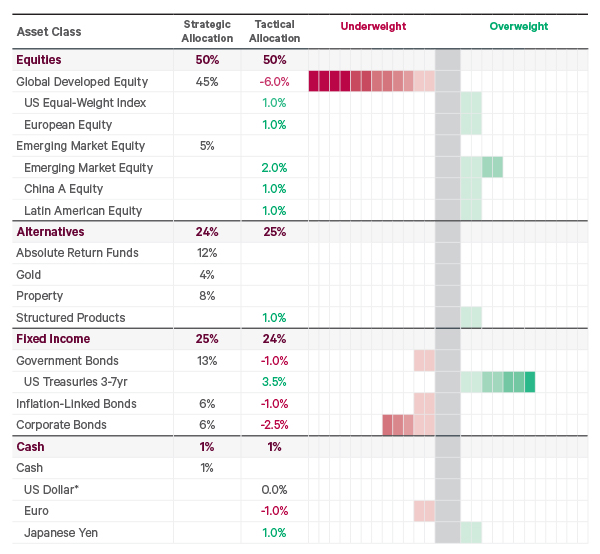
Note that each box represents 0.5% of the overall portfolio. The blue circle indicates the tactical under-over-weight at the overall asset class level. * The tactical equity allocation means that there is a further 3% underweight to US dollars.
Portfolio Changes in Q2 2026
1. In April, we reduced our overweight to European equities. Partly because the valuation gap to the US index had narrowed on its out-performance, and partly because we viewed Europe as being on the wrong side of both a potential energy crisis and the re-emerging technology rally.
2. Rather than put the capital above back into global developed equities, which is roughly 70% the expensive US market, we used it to increase our overweight in emerging markets, which we still viewed as more attractive, and an alternative play on the AI boom.
3. In April, we also removed the last part of our US dollar hedge. The dollar had strengthened when the Iran war started but then faded again down to 1.18 vs the euro, or almost 1.36 vs the pound, on news of a ceasefire.
4. In May, we removed a long-standing tactical position in Asian high yield bonds. The yield spread gap over government bonds had shrunk to normal levels, yielding attractive returns, and we noted that the prominent Asian countries in the bond index were more sensitive to energy imports and were weaker on the technology front.
5. In May, we also strategically rebalanced our equity allocation between developed and emerging markets, as it had moved out of line from index weights.
If you would like to hear more about how Davy’s team of investment experts can help you build an investment strategy to meet your goals, why not request a call with one of our Advisors today.
1 GDP is gross domestic product, the standard measure of economic activity.
2 While GDP includes business investment as positive growth much of the AI equipment is imported into the US, and imports are counted as negative growth in GDP calculations.
3 The AI hyperscalers are Alphabet, Amazon, Meta, Microsoft and Oracle.
4 The Shiller PE is the best known version of a normalised price / earnings ratio. It uses a 10-year window for earnings and adjusts the earnings for inflation.