From Liberation Day tariffs to the attack on Iran, the past 12 months have been a bumpy ride for investors. Since the start of the decade, we have also had to deal with the COVID-19 crisis, the Russian invasion of Ukraine, and the double-digit inflation that followed.
Figure 1: H1 market declines this decade so far
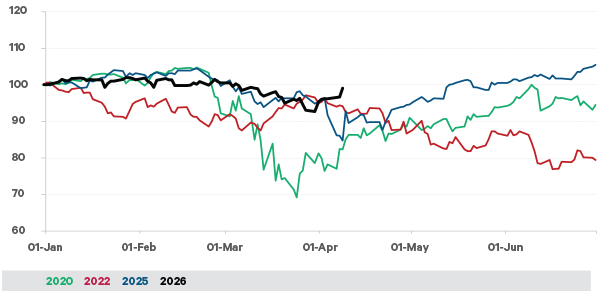
Source: Bloomberg, Standard & Poors, Davy. Price returns in US dollars.
Almost every other year this decade has brought us either into a bear market (2020 & 2022) or very close to one (2025) and yet staying invested through these years has been richly rewarding. Have we become desensitised to economic stress or political shocks? Are we naïve to assume that markets can continue to weather President Trump’s surprises?
In our outlook for Q2 2026, we examine the impact of energy shocks and compare the current situation with previous episodes. We look at the underlying health of the major economies, the valuations of the stock market and the expectations built into the technology sector.
The revenge of the oil economy
The immediate danger to the world economy is the evolving energy crisis. At the time of writing, the Strait of Hormuz is blocked, oil prices are up over 50% on the year, and supplies of refined products (diesel, jet fuel etc.) and by-products (urea for fertilizer, helium for technology) are running short. It’s tough to ignore the relationship between oil prices and economic cycles.
As Figure 2 shows, every US recession since 1973, except the COVID-19 pandemic, has been preceded by a surge in oil prices. However, it is worth noting that this covers two different types of resource problems – supply-driven and demand-driven. This distinction is important for policy and market reactions. Also important is the health of the economy at the time.
Figure 2: The price of oil and US recessions (1970-2026)
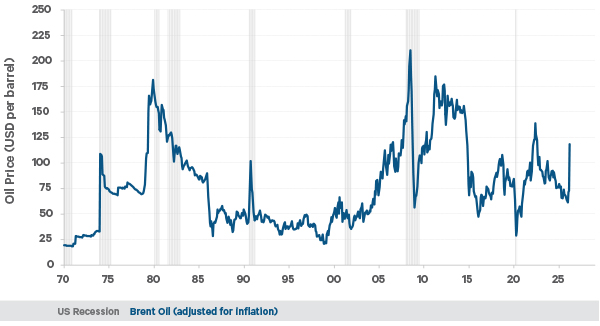
Source: DataStream, NBER (National Bureau of Economic Research). Oil price is adjusted for US CPI (consumer price index).
Demand-driven shortages are a result of the economy doing so well that it pushes up prices for resources. For example, the commodity super-cycle of the early 2000s when China emerged as an industrial superpower. Usually, these are periods of positive asset returns, until eventually central banks try to slow demand by raising interest rates. The oil price peaks; the economy and stock markets cool off and rates go lower.
Supply-driven shortages, such as the Arab oil embargo of 1973-74, are much more difficult. The energy constraint itself can bring an economy close to recession and central banks are caught between trying to fight inflation and stimulate the economy. As in the 1970s, or in 2022, these are negative periods for both stocks and bonds.
Coming into 2026, the world economy was doing fine, despite last year’s trade war. Energy markets had largely rebalanced post the Russian invasion of Ukraine, and any hint of demand-driven price pressure was in metals. The closure of the Strait of Hormuz is a global supply crisis, and although it was caused by the US, the economic impact will be felt more in Europe and Asia.
Figure 3: The estimated impact of a sustained 10% oil price increase
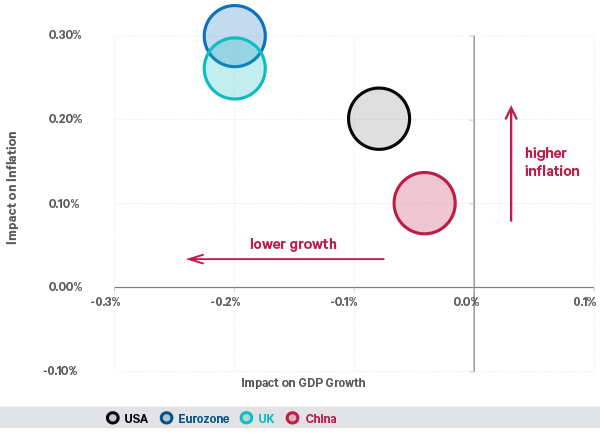
Source: Goldman Sachs Research.
The graph dots are large to reflect the high levels of uncertainty in the estimates.
If the Strait is re-opened and supplies do resume, the damage and disruption to date means it may take some months to rebalance energy markets, and prices will not go back to previous levels quickly. Now that Iran has shown that supply is easily disrupted, there will likely be some residual fear premium in the oil price, and maybe even a toll to the Iranians.
How strong is the economy?
Despite President Trump rating it A+++++, the Q4 GDP1 figures showed the US economy slowing into the end of 2025, mostly due to the longest ever shutdown of the federal government. There were high hopes for 2026 growth, due to the sugar rush of tax cuts and investment incentives from last year’s OBBBA (One Big Beautiful Bill Act).
Figure 4: Economic growth forecasts for 2026
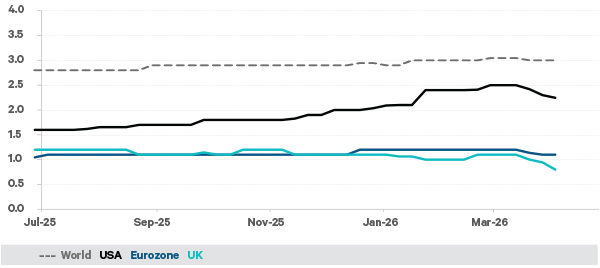
Source: Bloomberg. Forecasts are in real GDP terms in each local currency
Closer to home, the Eurozone was expected to see the effects of increased German spending on infrastructure while the whole continent upped their defense spending. The UK came into the year in a tighter fiscal spot but was expected to muddle along at roughly a 1% pace – not fast enough to help the Labour government but not enough of a crisis to force a change yet.
Given its energy resources and higher trend growth, we see from Figure 3 that oil prices are going to have to stay very high for some time to drag the US into recession. Unfortunately, while the Eurozone and UK were ultimately able to manage the 2022 crisis, weaker growth and higher sensitivity to energy prices make them more vulnerable, and if the current disruption lasts a few more months, recession is a real risk.
The US is not immune to economic problems though. Before the attack on Iran, inflation was still refusing to fall to the 2% target, and the poor jobs data which lead Trump to fire the head of the BLS (Bureau for Labor Statistics) last year was still a concern.
Figure 5: US job availability points to higher unemployment
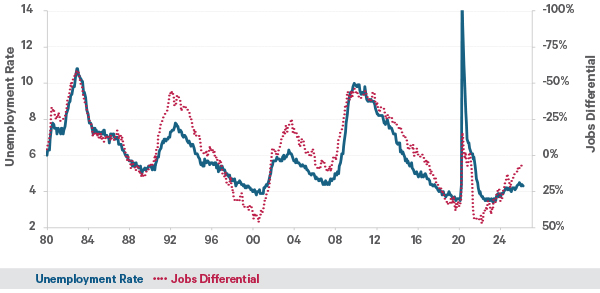
Source: Bloomberg, BLS (Bureau of Labor Statistics). The jobs differential is the difference between those saying jobs are plentiful vs hard to get.
Although the numbers have been volatile, US job growth in early April was surprisingly strong, and before this month business surveys suggested stronger hiring. However, job-seeker surveys are still pointing to a tougher job market. We note that unemployment in both the Eurozone and UK has ticked up this year, to 6.1% and 5.2% respectively.
Beware of credit cockroaches
Of course, recessions or bear markets don’t normally have one simple cause, they’re usually the result of several problems landing around the same time. On top of an energy crisis, pessimists currently point to equity valuations approaching late 1990s levels (more on that later) and cracks in the credit market reminiscent of 2007.
Since banks were forced to curtail risky lending after the global financial crisis, private debt has grown significantly, and it was probably only a matter of time before issues emerged. Although the defaults we saw last year were firm-specific, Jamie Dimon (CEO of JP Morgan) made the point that once you see a few cockroaches there will likely be more.
Where we had sub-prime mortgages in 2008, we have lending to private equity-backed technology deals in 2026. Publicly listed credit vehicles, known as BDCs2, have seen their prices tumble, and asset managers have had to gate their private credit funds as they cannot meet investor demand for redemptions. The fear now is that losses spread from this opaque market and lead to another credit crisis.
Figure 6: US credit markets now vs mortgages in 2007
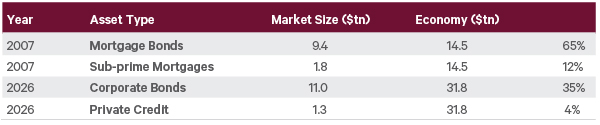
Source: JP Morgan, SIFMA. Corporate bonds includes investment grade and high yield bonds.
Comparing the size of the private credit market now with mortgages in 2007 shows how much smaller the issue is. Also, the typical investor now has 1 times leverage compared with banks that were levered 20-30 times in 2007. We don’t doubt that deals will fail, and some funds will lose money, but it seems more of a liquidity crisis than the onset of a credit crisis. If anything, it should be an opportunity for distressed debt managers.
The stock market – Driven by oil or hot air?
As outlined above, oil price surges can be driven by strength of demand or loss of supply (or both), and this tends to determine the relationship with the stock market. For example, the pre-financial crisis period (2003-2007) saw strong demand growth and bull markets in both stocks and oil. Before the Russian invasion of Ukraine, the post-COVID-19 recovery boosted both.
Figure 7: US equity index vs the oil price
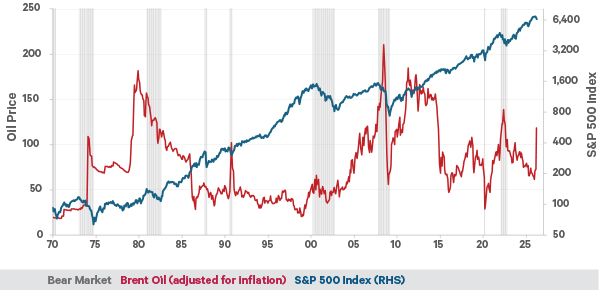
Source: DataStream, Standard & Poors. Oil price is adjusted for US CPI (consumer price index).
Where the correlation turns negative for equities is when the price shock is supply-driven, and this is the fear hanging over the market at the moment.
As for what happens stocks when the oil price stops going up, this is highly dependent on the economic environment. In many of the historical examples, there is a bear market not long after the peak, but this is usually because there is a recession then too, for oil or other reasons.
Given the strength of the US economy before March, our base case is no oil-related recession or bear market there for now. This seems to be the market’s view too, given the relatively small decline we saw. Europe will find it tougher, which is reflected in the larger market decline there.
Our concerns for the US stock market remain the expensive valuations, the dominance of the technology sector and the AI (artificial intelligence)theme, and we have been underweight in the US and the technology sector for some time now.
The good news is that the US valuations have derated slightly, meaning the price/earnings ratio has come down. This has happened because US stock prices have lagged in recent months and because the forecast earnings keep rising. Last year US technology stocks delivered double-digit earnings growth, as did healthcare, financials and materials.
Figure 8: US and European earnings growth and valuation since 2020
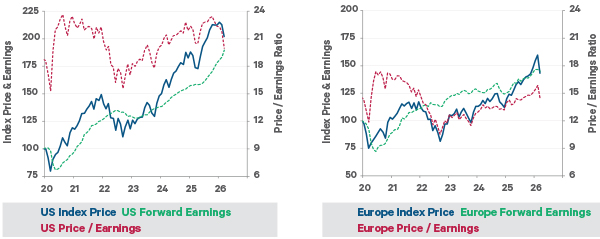
Source: MSCI, Davy. All calculations are in US dollars.
The contrast with Europe is stark. Last year was only the second year in ten that the European index beat the US, and that was because of a valuation increase, not superior earnings growth. Of course, the US has more high-growth companies than Europe but at some point, growth expectations can be too high and even the technology sector can come undone.
Heavy vs soft stocks
Before the attacks on Iran even began the stock market was reliving its own version of the 1970s. Since the end of last October, boring old sectors like energy, materials and industrials overtook technology as the market turned to ‘HALO’ stocks.
Fearful of AI disruption, investors sought heavy asset / low obsolescence companies whose physical businesses made them less vulnerable than information-based companies.
Every other week in the first quarter brought another AI breakthrough that promised to render another business model obsolete. Media, logistics and wealth management all suffered, but the 35% sell-off in the software sector caught our attention. While time will tell who survives and thrives, such a rapid decline makes us question whether markets had overreacted.
Figure 9: Re-rating in the stock market since October 2025
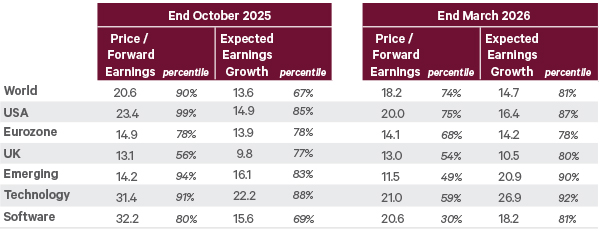
Source: MSCI, Davy. Expected earnings growth in October was for 2025-27 and in March was for 2026-28. Percentiles are based on data from 1995 to present. All indices in US dollars, except Eurozone in euro and UK in pounds.
Comparing the indices now with October, we find that all the regions have become cheaper. The biggest drop is in technology where the price/earnings ratio fell from 31x to 21x, which is close to the historical average for the sector. Software now trades below the average of its own history.
However, the price/earnings ratio has gone down partly because expected earnings growth has gone up. While analysts typically over-estimate future profits, it doesn’t make sense that software is selling off for fear of AI disruption and yet 3-year earnings estimates are increasing. If we haircut these growth forecasts, then the valuation is not as cheap as it appears.
Message in a bond yield
While equity markets usually attract the most headlines, and were thought to influence President Trump, bond markets can exert more power. Not least because most governments have so much debt and they continue to borrow. The threat of inflation in March naturally pushed up bond yields, but there was more going on than first assumed.
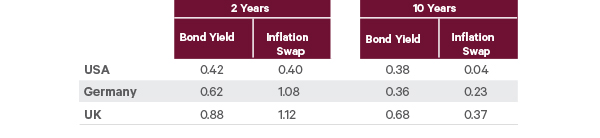
Bond yields embed various economic expectations, including inflation and interest rates. Over the month of March, short term (2-year) bond yields rose by 0.4% in the US and by more in the Eurozone and UK. This was explained by the rise in the 2-year inflation swap yields3, with local economies more vulnerable to an energy crisis.
Figure 10: Bloomberg. All yield increases are quoted in local currencies.
Source: MSCI, Davy calculations. Covering the period from 1995 to 2025. Each regional index is in local currency, except World is measured in dollars.
Long-term (10-year) yields also rose, by 0.4% in the US and Eurozone and by more in the UK. But 10-year inflation pricing rose by much less. Markets appear to be demanding extra yield for something else – perhaps higher inflation uncertainty, or larger longterm fiscal risks as government budgets are strained even further by energy or other crises.
Given that central banks will not want to weaken their economies further in an energy crisis, we believe that markets are overestimating the potential for rate hikes and expect short-term yields to come down again (as they have started to do). The movement in longer-term yields is something we are watching closely.
Given the situation in Iran, it is more difficult than usual to hold strong views on the economy or markets. It is tempting to compare this period with previous energy crises, but none quite match up. Our base case is that we emerge with higher inflation and lower growth than expected in January, but not a recession, and markets have mostly adjusted to this outcome already.
Energy prices are moving with the headlines, but even if they stay 20-30% above pre-March levels for the rest of the year, this would be manageable for the US. It would make the Eurozone and UK more vulnerable to a downturn but not cause a recession on its own. A longer conflict, and prolonged loss of energy supplies, could do so.
Higher inflation will delay US and UK plans to cut interest rates, but is unlikely to force many rate hikes, especially if growth weakens. Higher bond yields may be an opportunity for liquidity investors to increase the duration of their cash holdings.
Private credit markets are struggling with levered investments in the technology area and liquidity demands from their investors, but the problem is not large or systemic enough to lead to another credit crisis. We note that we do not hold any private credit funds in Davy portfolios.
As for equity markets, we welcome the lower valuations, especially in the US and the technology sector. But we question the higher earnings forecasts that flatter these valuation ratios. We still find markets outside the US more attractive, especially emerging markets.
Clients will have heard us stress the importance of diversification many times before, and an inflation shock can really test a portfolio. This time gold did not rally to cushion the impact on stocks and bonds, but the US dollar did, reminding us that rumours of its demise are greatly exaggerated.
While we can’t predict how or when the energy situation will be resolved, we believe that our current asset allocation, broadly diversified and under-weight the more stretched assets, is the most appropriate stance to take. If the situation deteriorates and markets dislocate, we stand ready to adapt to the opportunities that arise.
Figure 11: Strategic and tactical asset allocation for EUR moderate growth portfolio
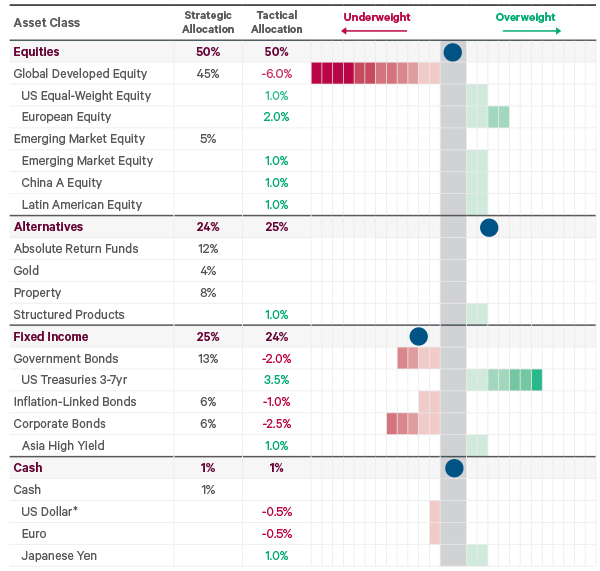
*Note that each box represents 0.5% of the overall portfolio. The blue circle indicates the tactical under-over-weight at the overall asset class level. * The tactical equity allocation means that there is a further 3% underweight to US dollars.
Portfolio Changes in Q1 2026
1. In January, we rotated part of our developed market equity allocation into broad emerging markets. This was to take advantage of the attractive valuation discount, improving earnings outlook and increasing fund flows.
2. In February, we reduced our overweight to Latin American equities, to take partial profit on the unexpectedly large out-performance. The capital was returned to developed equities, reducing our underweight to US dollars.
3. We made no changes in March, as the disruption did not lead to large enough dislocation, despite the considerable day-to-day volatility.
If you would like to hear more about how Davy’s team of investment experts can help you build an investment strategy to meet your goals, why not request a call with one of our Advisers today.
1 GDP is gross domestic product, the standard measure of economic activity.
2 A BDC, or a business development company, is a closed-end investment fund that finances small to medium sized companies. They are used to allow retail investors access private markets.
3 Inflation swaps are generally priced using CPI, the consumer price index. However in the UK, inflation-linked bonds and inflation swaps use RPI, the retail price index