Global equities continued to rise last week. Demand for artificial intelligence infrastructure continued to drive market returns, while earnings season maintained its strong positive momentum. The headline data release was the April jobs report in the US. Nonfarm payrolls figures increased for the second consecutive month, with the US adding 115,000 jobs in April – well-ahead of the 62,000 consensus forecast. A number of Purchasing Managers’ Index (PMI) surveys were released globally. In the US, the S&P Global Services PMI fell to 51.0, while in Europe, the final estimate of the April Manufacturing PMI was unchanged at 52.2. In Australia, the Reserve Bank of Australia increased interest rates by 25bps, as expected, marking the third hike of the cycle for the central bank.
Last week's highlights
 |
- S&P Global Services PMI (05/05) – Fell to 51.0 (vs 51.3 expected)
- Nonfarm Payrolls (08/05) – 115k jobs added in April (vs 65k expected)
|
 |
- S&P Global Eurozone Manufacturing PMIs (04/05) – Final estimate for April unchanged at 52.2, in line with expectations
|
 |
- S&P Global Composite PMI (05/05) – Final estimate for April at 52.6, in line with expectations
|
 |
- Reserve Bank of Australia Meeting (05/05) – Increased interest rates by 25bps, as expected
|
This week will include several notable data releases in the US. Two measures of inflation – the Consumer Price Index (CPI) and the Producer Price Index (PPI) – will be published on Tuesday and Wednesday, respectively. Both readings will be closely watched for any evidence of oil-related inflation. In the United Kingdom, a preliminary estimate of Q1 gross domestic product (GDP) will be released on Thursday, alongside an industrial production reading. In Europe, Germany’s ZEW survey will provide a measure of economic sentiment in the region. Further afield, CPI will released in China during the week, along with a PPI print in Japan.
What's on the radar
|
- CPI Inflation (12/05)
- PPI Inflation (13/05)
- Retail Sales (14/05)
|
|
- Germany ZEW Survey (12/05)
|
|
- Preliminary Q1 Gross Domestic Product (14/05)
- Industrial Production (14/05)
|
|
- China CPI Inflation (11/05)
- Japan PPI Inflation (15/05)
|
Chart of the moment - Chip happens
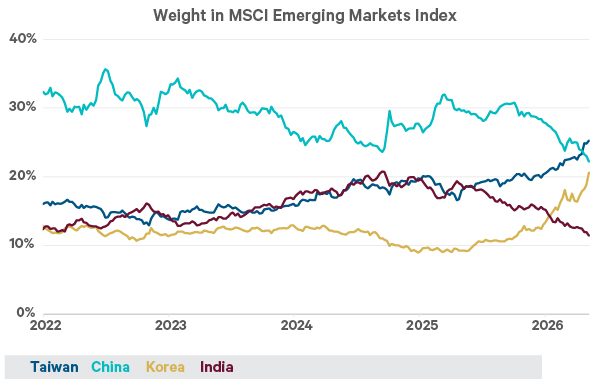
Source: Bloomberg, May 8th 2026.
- Taiwan has recently overtaken China as the largest regional weight in the MSCI Emerging Markets Index, with the market capitalisation of its equity market surpassing that of China
- South Korea has also seen a dramatic rise in its index weighting in recent months, overtaking India, which had previously been gaining share in the index
- For both Taiwan and South Korea, this trend has been underpinned by the acceleration of AI infrastructure demand. Strong growth in demand for semiconductors and memory chips has driven dramatic rises in equities across both regions.