US equities finished higher last week, as the S&P 500 rose for an eighth consecutive week. Enthusiasm around artificial intelligence (AI) continued, with NVIDIA posting stronger-than-expected results. In Europe, equities also rose as progress towards a peace deal in the Middle East continued.
On the data front, Purchasing Managers’ Index (PMI) surveys were released in the US and Europe. In the US, manufacturing increased to 55.3, while services fell to 50.9 but remained in expansionary territory. In Europe, there were drops in both the manufacturing and services prints as the drag from increased oil prices started to weigh on Eurozone economies. In the United Kingdom, the unemployment rate for April was published, increasing to 5.0%. Meanwhile, an inflation print showed that prices increases during April were slower than expected. Further afield, in China, both retail sales and industrial production figures disappointed investors, coming in below consensus at 0.2% YoY and 4.1% YoY, respectively. In Japan, a Gross Domestic Product release showed growth of 0.5% over Q1, ahead of consensus.
Last week's highlights
 |
- S&P Global Preliminary Manufacturing PMI (21/05) – Increased to 55.3 (vs 53.8 consensus)
- S&P Global Preliminary Services PMI (21/05) – Fell to 50.9 (vs 51.2 consensus)
|
 |
- Eurozone CPI (20/05) – Final revision unchanged at 3.0% YoY
- S&P HCOB Manufacturing & Services PMI (21/05) – Manufacturing decreased to 51.4 while services decreased to 46.4
|
 |
- UK Unemployment Rate (19/05) – Increased to 5.0%, above expectations
- UK CPI (20/05) – Slowed to 2.8% YoY, below consensus expectations
|
 |
- China Retail Sales (18/05) – Grew at 0.2% YoY, lower than expectations
- China Industrial Production (18/05) – Growth slowed to 4.1% YoY (vs 6% expectations)
- Japan Q1 GDP (19/05) – Preliminary Q1 estimate at 0.5% QoQ, ahead of expectations
|
This week, the Conference Board will release their consumer confidence measure in the US. In Europe, the European Commission will publish their Economic Sentiment Indicator on Thursday along with an industrial confidence measure. In Japan, Tokyo inflation will be released for April, along with retail sales and industrial production data.
What's on the radar
|
- Conference Board Consumer Confidence (26/05)
|
|
- Eurozone Economic & Industrial Confidence (28/05)
|
|
- Lloyds Business Barometer (29/05)
|
|
- Japan Tokyo CPI (29/05)
- Japan Retail Sales (29/05)
- Japan Industrial Production (29/05)
|
Chart of the moment - Leading the way
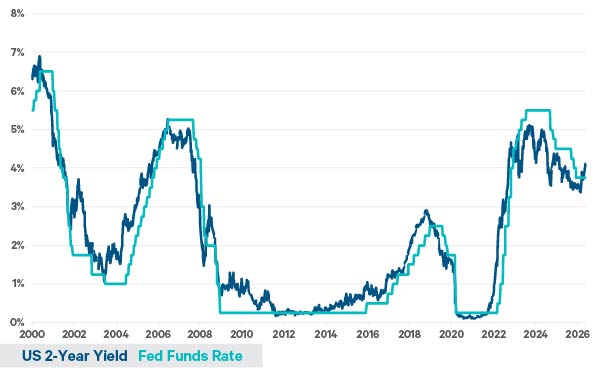
Source: Bloomberg as of 22/05/2026
- Inflation concerns in the US have driven the US 2-year yield higher in recent weeks, pushing it well above the upper bound of the Fed Funds Rate.
- Over the last 30 years, whenever the two-year bond yield crossed above the Fed Funds Rate, the FOMC typically responded with a hike.
- With Kevin Warsh just beginning his tenure as Fed Chair, It remains to be seen whether a hawkish pivot is looming at the central bank’s June meeting.