US equities edged higher for the week. Economic data remained broadly supportive, with the ISM Manufacturing PMI staying in expansionary territory at 54.6, although the survey's prices paid component remained elevated at 72.6. Labour market data was mixed but remained broadly stable. Nonfarm payrolls showed US employers added 162,000 jobs in August, well ahead of the 55,000 forecast, while JOLTS data indicated job openings were broadly unchanged at 7.3 million. In contrast, ADP employment growth came in softer than expected at 38,000 versus forecasts of 47,000.
Eurozone headline inflation accelerated to 3.3% in August from 2.9% in July, driven primarily by energy inflation. In the UK, S&P Global PMIs showed continued expansion, coming in at 52.5. China’s official Manufacturing PMI rose from 49.2 to 49.8, beating expectations, but still below expansionary territory. The Reserve Bank of New Zealand raised rates by 25 basis points to 2.75% citing inflation of 4.1% and the need to return towards 2%. The Bank of Canada left its policy rate unchanged at 2.25%, as expected.
Last week's highlights
 |
- ISM Manufacturing & Services PMIs (01/09 & 03/09) – Manufacturing PMI fell to 54.6 while services PMI came in at 55.4.
- JOLTS Job Openings (01/09) - Broadly unchanged at 7.27 million.
- Nonfarm Payrolls (04/09) - Came in at 162k, well ahead of 55k forecast.
|
 |
- Eurozone CPI (01/09) - Accelerated to 3.3% in August from 2.9% in July, driven primarily by energy inflation.
|
 |
- S&P Global PMIs (03/09) – UK composite PMI rose to 52.5 from 52.2, the highest since April.
|
 |
- China Manufacturing PMI (31/08) - Rose from 49.2 to 49.8 beating expectations, but still below expansion threshold
- Reserve Bank of New Zealand meeting (02/09) - Raised rates by 25 basis points to 2.75% as expected and indicated that further tightening was likely
- Bank of Canada meeting (02/09) - Left policy rate unchanged at 2.25%.
|
Looking ahead to this week, investors will focus on US CPI and the European Central Bank’s (ECB) rate decision. Markets expect the ECB to raise rates as inflation remains well above target and economic growth continues to show resilience. German inflation, UK monthly GDP and Japan’s final Q2 GDP reading will also be released.
What's on the radar
|
- 10-Year Note Auction (09/09)
- Initial Jobless Claims (10/09)
- US August CPI (11/09)
|
|
- ECB Interest Rate Decision (10/09)
- German August CPI (10/09)
|
|
|
|
|
Chart of the moment - Yielding to temptation
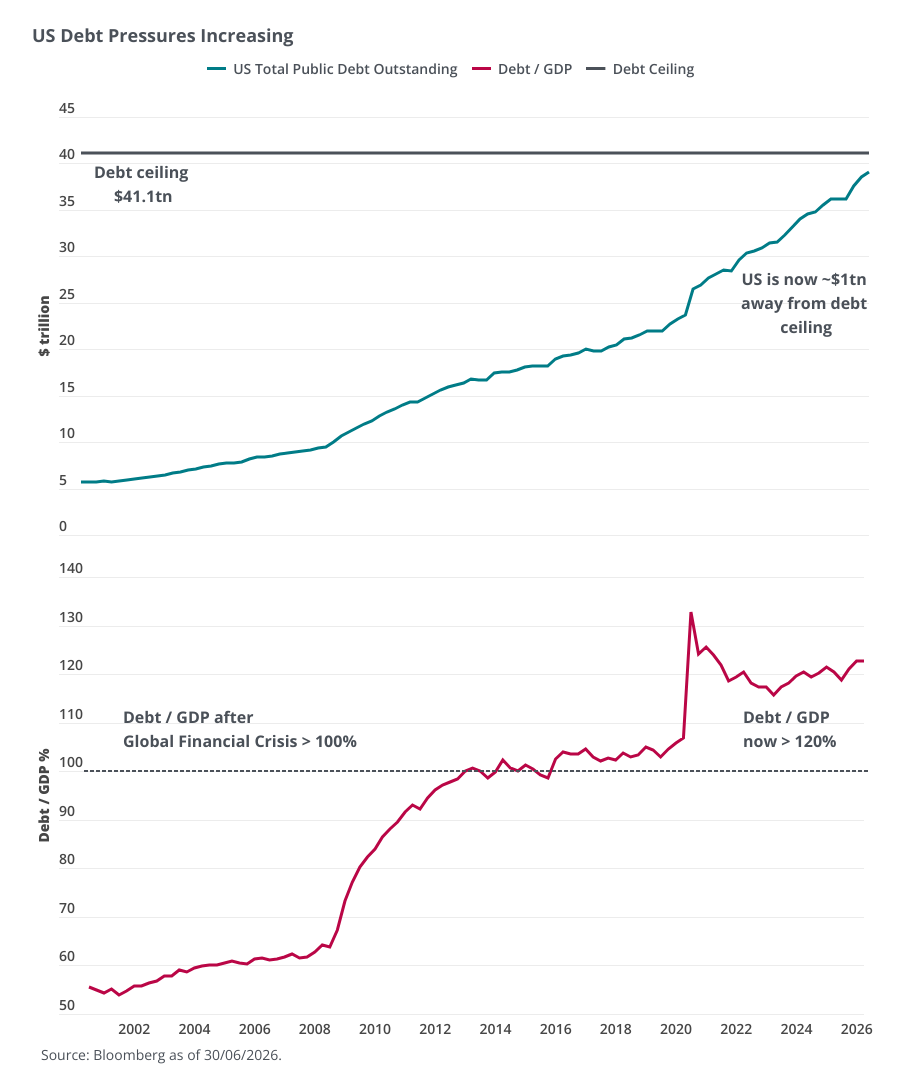
- US public debt has risen sharply over the past two decades and is now greater than 120%, more than double the debt / GDP ratio of 2006.
- In absolute terms, public debt has now exceeded $40 trillion and is approaching the current debt ceiling of $41.1 trillion.
- The combination of growing budget deficits, expected to reach 6-7% for 2026, and higher borrowing costs have resulted in markets questioning the sustainability of US public debt.