Politicians have shaped the market narrative this year with US President Trump’s tariff announcement on 2nd April having the most dramatic impact. Over the following week, the S&P500 dropped into bear market1 territory. But the President pulled back from his extreme position, and the ‘Trump Put’2 became a turning point for investors. Since then, trade agreements have gradually been announced. The One Big Beautiful Bill Act (OBBBA) passed into law, and its tax incentives provide a tailwind for corporate earnings. The US Federal Reserve (the Fed) lowered interest rates and signalled more loosening to come. All of this helped equities recover from the initial tariff shock.
After a falling out of favour in the first quarter of the year, the Artificial Intelligence (AI) theme has taken the lead again, powering the S&P500 and the Nasdaq to new highs. While uncertainties around trade policy and higher tariffs have impacted other sectors, AI has provided a growth story that seems insulated from concerns about the broader economy. Although Trump’s relationship with the titans of tech is complicated, maintaining US technological leadership and backing winners has obvious appeal for him.
Since the market bottomed on 8th April, the global technology sector has bounced 47% and it has accounted for 45% of the rise in the world equity index. Ten US companies - some outside the tech sector itself, but all considered plays on AI - have been responsible for almost half of the rebound in global equities.
Propelled by its higher exposure to technology, the US has outperformed broader global indices in this upturn. Even though the US dollar has depreciated by almost 7% versus the euro since 8th April, the S&P500 has generated market beating returns in both dollar and euro terms.
The US represents almost three-quarters of the world index and the seven largest US companies – the Magnificent 73 - account for over a third of its weight. The chart below shows the influence of these mega-cap stocks. The equally weighted S&P500 - where every company is given an equal level of importance regardless of size – is up 16% in euro terms since the triggering of the Trump Put. The market weighted S&P500 has risen 26% and it’s been led higher by the Magnificent 7, which collectively have climbed 50% in less than six months.
So, it’s been a narrow rally, centred on one theme, and in a very concentrated market.
Figure 1: US Indices since 8th April - the ‘Trump Put’ was triggered on 9th April
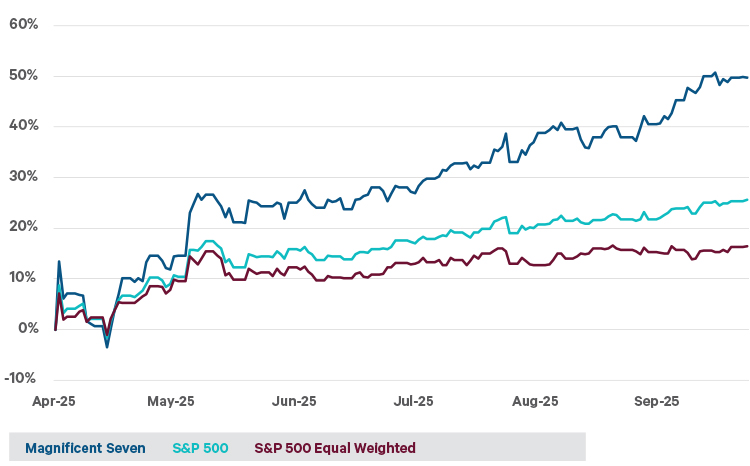
Source: Bloomberg. Total return in euro.
Adrenaline rush
In the race to create a ‘digital god’ the more companies spend on AI infrastructure the more their share prices seem to rise. Every day brings new announcements about data centre buildouts with massive power requirements. There’s almost a breathless sense of urgency and a curious circularity.
Database and enterprise management software company Oracle soared 36% on the day of its results, an enormous move for a company of its size. Increasingly, it’s becoming a datacentre operator for the AI players. Oracle’s reported numbers didn’t drive the shares higher – quarterly earnings per share only increased 6%. It was the order book that captivated: remaining performance obligations (RPO)4 jumped 360% year-on-year to US$455bn. This compares to Oracle’s overall revenue of US$57bn in the fiscal year ended May 2025.
It’s a huge order book but it’s highly concentrated. According to the Wall Street Journal, US$300bn of RPO is from one customer, ChatGPT maker OpenAI. The contract will require 4.5 gigawatts of power capacity, roughly comparable to the electricity produced by more than two Hoover Dams or the amount consumed by about four million homes. To put that in a local perspective, there are 2.1 million dwellings in Ireland.
OpenAI’s annual revenue run rate is estimated at US$17bn. So how will it pay for its enormous contract with Oracle?
Within two weeks of Oracle’s results, Nvidia, the leading AI chip provider said it would take a US$100 bn equity stake in OpenAI. This would be the largest-ever investment in a private company. Nvidia can afford it – it’s the largest company in the world with a market capitalisation of US$4.3 trillion. As part of the deal, OpenAI will buy millions of Nvidia’s AI processors, aiming to deploy 10 gigawatts of capacity, which is equivalent to the output of ten nuclear reactors.
Morgan Stanley sees US$3trn of global spend on datacentre capacity by 2028. Will all this capex generate attractive returns for investors? Is a bubble5 building in AI? Time will tell. Artificial Intelligence is an important innovation but it’s also normal technology, we haven’t invented a new species. Tangible benefits of AI need to spread across industrial sectors.
Figure 2: Nvidia and the UBS AI Winners basket since 8th April
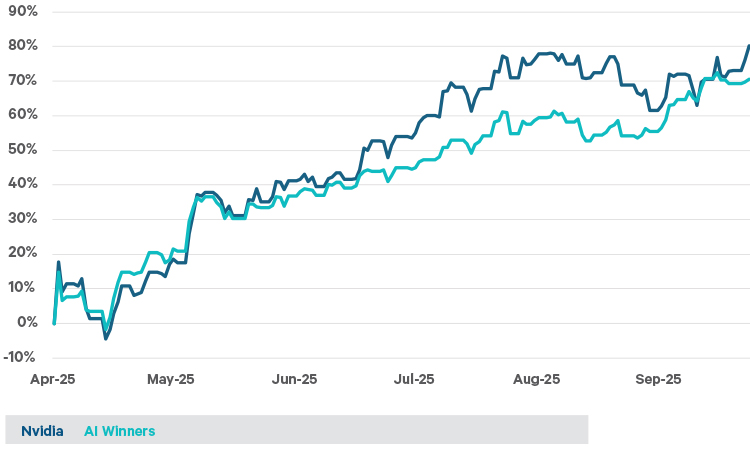
Source: Bloomberg. Total returns are in euro.
The AI Winners basket consists of 45 US stocks that UBS analysts have selected as the major plays on Artificial Intelligence. It includes hyper-scalers, chip providers, data centre equipment providers and power companies, including those involved in the nuclear industry. The AI Winners index has jumped 70% in Euro terms, or 84% in US Dollars, in less than six months.
There are some stocks in the basket that look a little speculative. One of them is OKLO. The company designs nuclear reactors. It doesn’t generate any earnings, it doesn’t even have any revenues. Yet its market capitalisation topped US$20bn in September, and its shares have risen five-fold since early April.
Thrill Seeker
It’s been 25 years since the last stock market bubble - the Tech, Telecom and Media (TMT) bubble burst in the year 2000. With some commentators saying, ‘it’s different this time’, are we due another boom and bust?
Valuations were much higher during previous bubbles. Today, the world index is on 20 times 12-month forward earnings. The US market is pushing that multiple up, with the S&P 500 on a price to earnings (P/E) multiple approaching 23. The Nasdaq is on 29 times earnings.
Back in the early 70’s the Nifty Fifty reached 45 times. In the 1980s, the P/E of the Japanese stock market was over 70 before it crashed, and during the TMT bubble, the Nasdaq peaked at about 60 times earnings in March 2000. By September of the following year, the index had dropped more than 70%.
Depressive slump
One sector that is certainly not in a bubble is healthcare. It’s the weakest sector year to date and it has completely failed to participate in the broader market rally since early April.
The chart shows the price to earnings multiple for the pharmaceuticals industry relative to the overall market over the last twenty years.
Figure 3: MSCI World Pharma, Biotech and Life Sciences Index price to earnings relative to the MSCI World Index
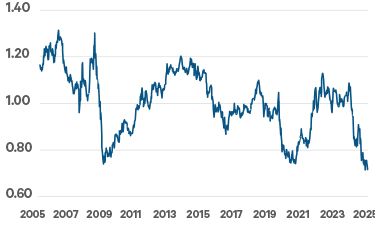
Source: Bloomberg.
Pharma has only been this cheap twice before, on a relative basis. Low valuations occurred during periods of major macro dislocation - the global financial crisis in 2008 and 2009, and the COVID-19 pandemic in 2020. These were times when, for the broader market, earnings forecasts had plummeted. The price-to-earnings multiple for the overall index then expanded in anticipation of economic rebound and earnings recovery.
This isn’t the case now – earnings expectations for the overall market haven’t weakened, we are not in an economic downturn, and the S&P500 is at a record high. The big concern for pharma is around pricing in the US. Trump is demanding lower prescription drug charges through his ‘Most Favoured Nation’ (MFN) policy. With MFN, drug prices would drop to match the lowest rate available in countries where GDP per capita is at least 60% of US levels.
The sector is pricing in a mid-teens hit to earnings. The US accounts for about half of the industries sales, and government channels account for approximately 30% of that. The President has no authority over non-government, commercial channels. Current pharma valuations imply a 50% cut to drug prices across all US government channels. While that seems overly aggressive, investors may be holding back because they’re afraid of Trump’s unpredictable tweets knocking share prices. Meanwhile, the AI winners have the momentum.
Animal spirits
Following Trump’s election win last November there was excitement about 2025 and a ‘golden age’ for merger and acquisition activity. Animal spirits were set to be unleashed. Then the President scared the horses with his erratic trade policy. Companies had to focus on managing their own operations through the uncertainty.
While management teams may not like the underlying terms of the various trade deals that have been agreed, at least they can return to strategic planning. The OBBBA enshrines tax cuts and incentives for investment, and corporates have strong balance sheets.
Merger and Acquisition (M&A) activity has picked up with over US$1trn of deals announced during the summer alone – the highest since the record-breaking summer of 2021. The biggest transaction is Union Pacific’s agreement to acquire Norfolk Southern for over US$80bn, creating the largest railroad operator in the US. In a market dominated by an AI capex race, perhaps it’s fitting that the biggest acquisition announced so far this year is occurring in an industry that experienced its own boom (and eventual bust) in the 19th century.
Remaining balanced
As we move through 2025, concerns about policy uncertainty – particularly Trump’s tariffs – have evolved into questions about the impact of those policies on inflation, consumers and company margins.
Quarterly earnings season will provide important indicators about how companies are managing. With the technology sector driving so much of the market’s return over the last few months it needs to follow through with strong results.
Looking to 2026, the gap in earnings growth between mega-cap tech and the rest of the market is forecast to shrink. A narrowing of the gap was expected to happen in 2025, but the tariff shock pushed that out. Broader earnings generation would be healthier for the market, rewarding diversification.
1 A bear market is a drop in the index price of 20% or more. By early April, the US market had fallen by 19% from its high point in February (measured in US dollars).
2 ’Trump Put’ refers to the expectation that Donald Trump would take market-supportive actions during times of financial stress, acting as a form of downside protection for investors.
3 The Magnificent 7 refers to the group of Alphabet, Amazon, Apple, Meta, Microsoft, Nvidia and Tesla.
4 Remaining Performance Obligations refer to the portion of contracted revenue that has not yet been recognised because the goods or services have not yet been delivered. These obligations represent future revenue expected to be recognised as the company fulfils its contractual commitments.
5 Bubble: A market condition where asset prices significantly exceed their intrinsic value, often driven by exuberant investor behaviour. Bubbles typically burst when confidence wanes, leading to sharp price declines.