Global equity indices rose for the second consecutive week amid signs of de-escalation and ongoing peace talks. On the data front, the March consumer price index (CPI) was released in the US. On a month-on-month basis, prices increased by 0.9% – their largest increase since 2022 – while the year-on-year figure reached 3.3%. Unsurprisingly, the acceleration was almost entirely attributed to rising energy costs, with evidence of spillover into the core goods and services components yet to materialise. The Fed’s preferred measure of inflation – the core personal consumption expenditures (PCE) index – was also published. The February figures were captured prior to the conflict but showed a deceleration in the pace of inflation to 3.0% year-on-year. The Institute of Supply Management (ISM) released its Services Purchasing Managers’ Index (PMI) survey for March, showing that activity in the sector slowed but remained in expansion. Additionally, the University of Michigan published its closely watched consumer sentiment on Friday, falling 10.7% from the March release to its lowest level on record.
Revised PMI surveys were also released for the Eurozone and the United Kingdom, with the composite figure revised up higher to 50.7 and down lower to 50.3, respectively. Further afield, inflation in China was slower than expected at 1.0% year-on-year, while both the Reserve Bank of India and the Reserve Bank of New Zealand left rates unchanged at their meetings, as expected.
Last week's highlights
 |
- ISM Services PMI (06/04) – Decreased to 54.0 (vs 54.9 expected)
- Core PCE Price Index (09/04) – Decelerated to 3.0% YoY, in line with consensus
- US CPI (10/04) – Increased 3.3% YoY (vs 3.4% consensus)
|
 |
- Eurozone Composite PMI (07/04) – Revised upwards to 50.7
|
 |
- S&P Global Composite PMI (07/04) – Revised downwards to 50.3
|
 |
- Reserve Bank of New Zealand Meeting (08/04) – Left rates unchanged, as expected
- Reserve Bank of India Meeting (08/04) – Left rates unchanged, as expected
- China CPI (10/04) – Inflation slowed to 1.0% (vs 1.1% expected)
|
This week, the producer price index (PPI) for March will be published in the US, along with a final estimate of Eurozone inflation. Additionally, in the United Kingdom, industrial production figures for February will be made available. In China, retail sales and Q1 gross domestic product (GDP) will also be released.
What's on the radar
|
- Producer Price Index (14/04)
|
|
- Eurozone March Inflation Final Estimate (16/04)
|
|
- February Industrial Production (16/04)
|
|
- China Q1 Gross Domestic Product (16/04)
- China Retail Sales (16/04)
|
Chart of the moment - Bucking the trend?
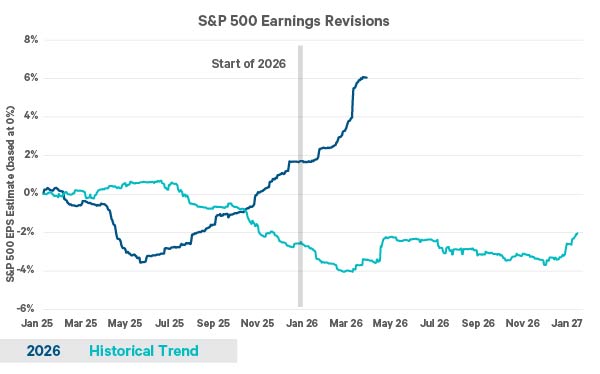
Source: Bloomberg as of 07/04/2026. Note: The chart shows S&P 500 earnings per share revisions, based at 0%. Historically, earnings estimates have started out higher and have been cut over time. For 2026, earnings estimates have moved higher. The median of earnings per share revisions from 2012-2025 is used for the "historical trend".
- S&P 500 earnings forecasts for 2026 have been upgraded aggressively in recent months.
- Earnings estimates typically begin at elevated levels before being revised downward over time, however, 2026 stands out as an exception to this pattern.
- Over the past three months, Technology and Energy have seen the strongest positive earnings revisions, while Consumer Discretionary and Industrials have experienced the weakest revisions.